Executions
The Executions tab contains all scheduled runs, executed runs, and currently running executions with all their details. It is the main place to monitor and manage test execution.
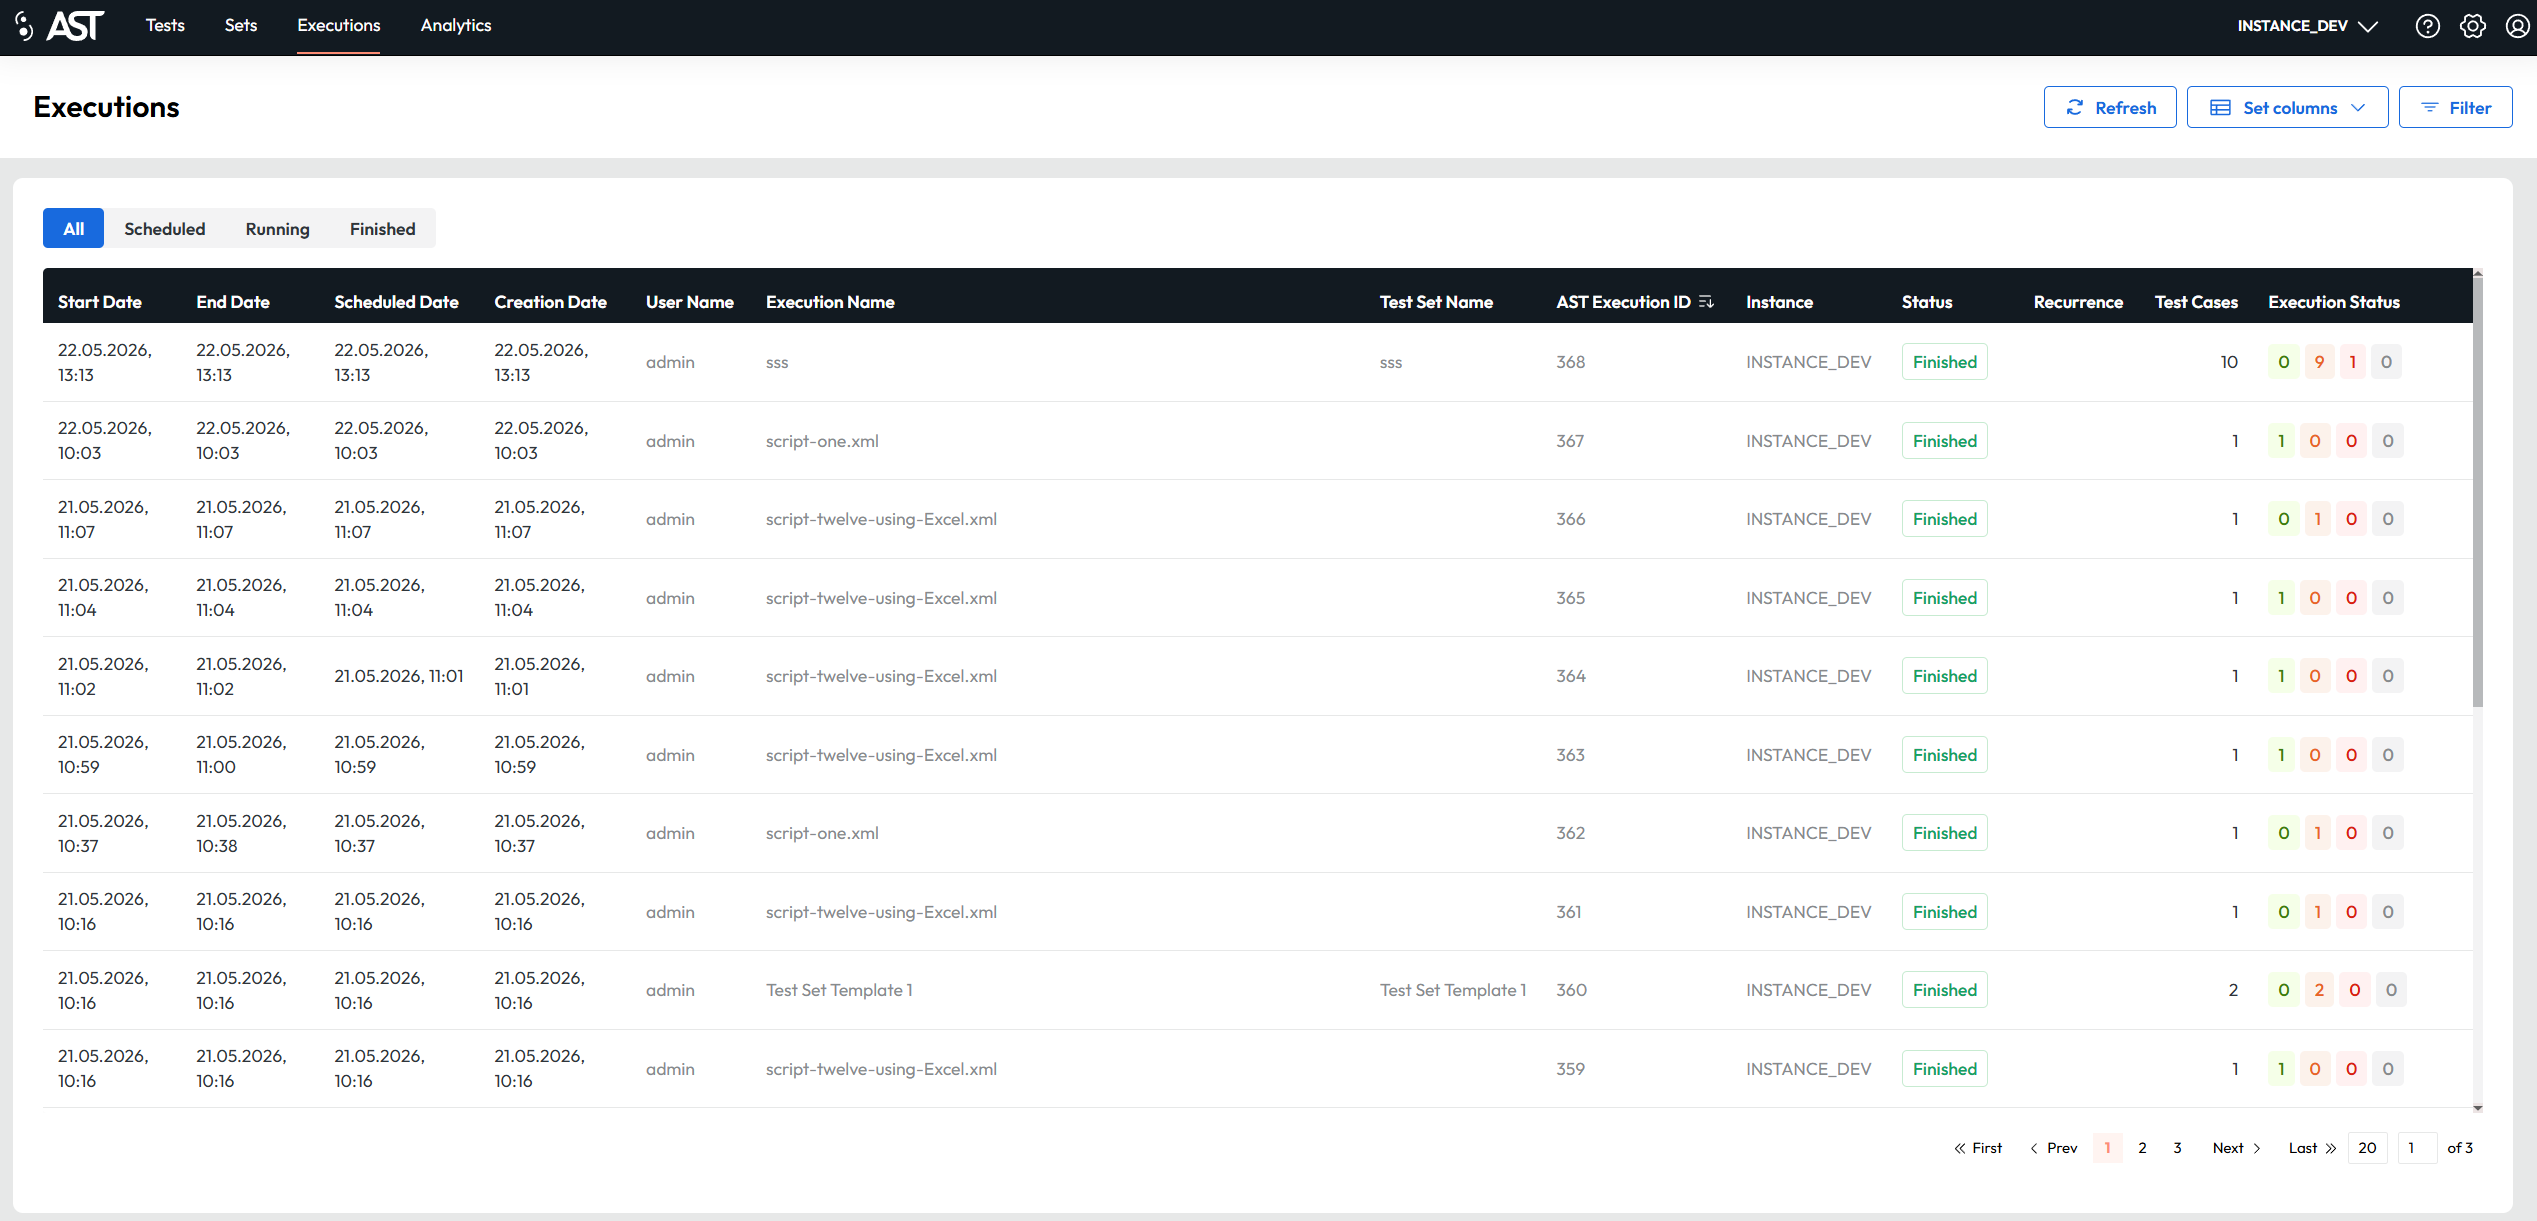
List of columns with explanations
| Column | Description |
|---|---|
| Start date | The date and time when the execution actually started |
| End date | The date and time when the execution actually ended |
| Scheduled date | The date and time the execution was planned to run |
| Creation date | The date and time the execution was created |
| User name | User name that scheduled the execution. Deleted users are displayed as !user# |
| Execution name | Name of the execution |
| Test set name | Name of the set being executed |
| Instance | Avaloq instance where tests are executed |
| Status | Status of the execution (Scheduled/Running/Finished) |
| Recurrence | Recurrence of this execution (e.g. daily, weekly, one-time) |
| Test cases | Number of test cases |
| AST execution ID | Internal identifier used by the AST system |
| External Xray | Id used for Xray sync |
| Execution status | Summary of test results (e.g. 5 Passed / 2 Failed / 1 Error) |
| Xray sync status | Displays the success/fail of the sync to xray |
| ALM sync status | Displays the success/fail of the sync to alm |
Table view customization
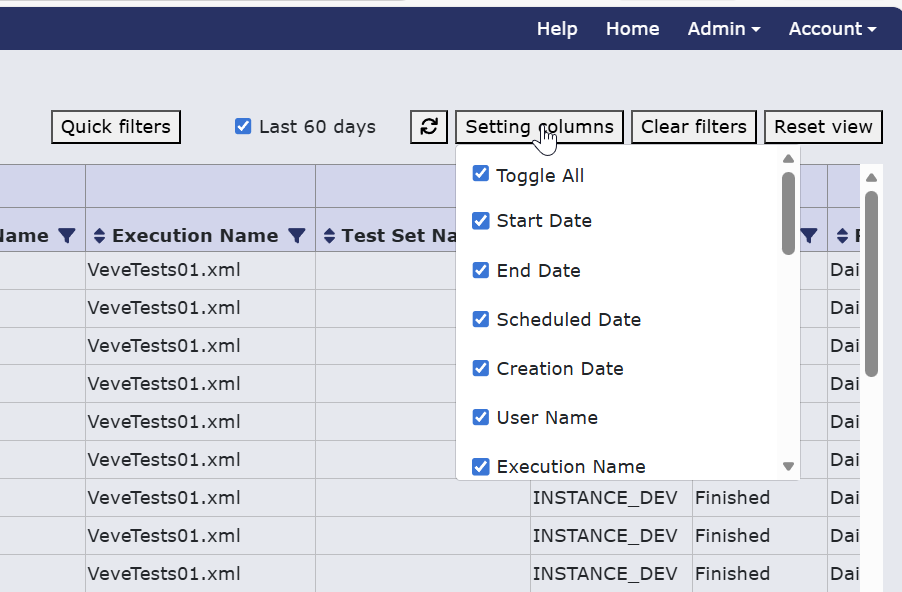
This table can be altered by adding or removing mentioned columns via clicking the 'Set columns' button. This will open a pop-up with all columns to be selected or unselected as checkboxes. The table can be set to its default view by clicking on 'Reset view' button.
Columns can also be pinned to the left side of the table by clicking on the pin icon in the 'Set columns' dropdown. This will make sure that the column is always visible when scrolling horizontally through the table. You can unpin the column by clicking on the pin icon again. The order of the pinned columns is determined by the order in which they were pinned, meaning that the first column you pin will be the leftmost one, and the last column you pin will be the rightmost one among the pinned columns.
Ordering
Ordering of the data in a column can be changed by clicking on the column header. This will order the data in descending order. Another click on the same column header will order the data in ascending order. To cancel the ordering, click on the column header again.
Ordering is applied after filtering, meaning that if you have some filters applied, the ordering will be applied only to the filtered data.
Filtering
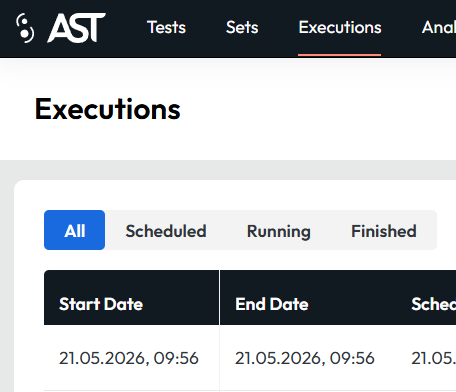
The first type of filter is the quick filter which allows you to filter by execution status e.g. Scheduled, Running and Finished executions. This filter is located on the top left side of the table.
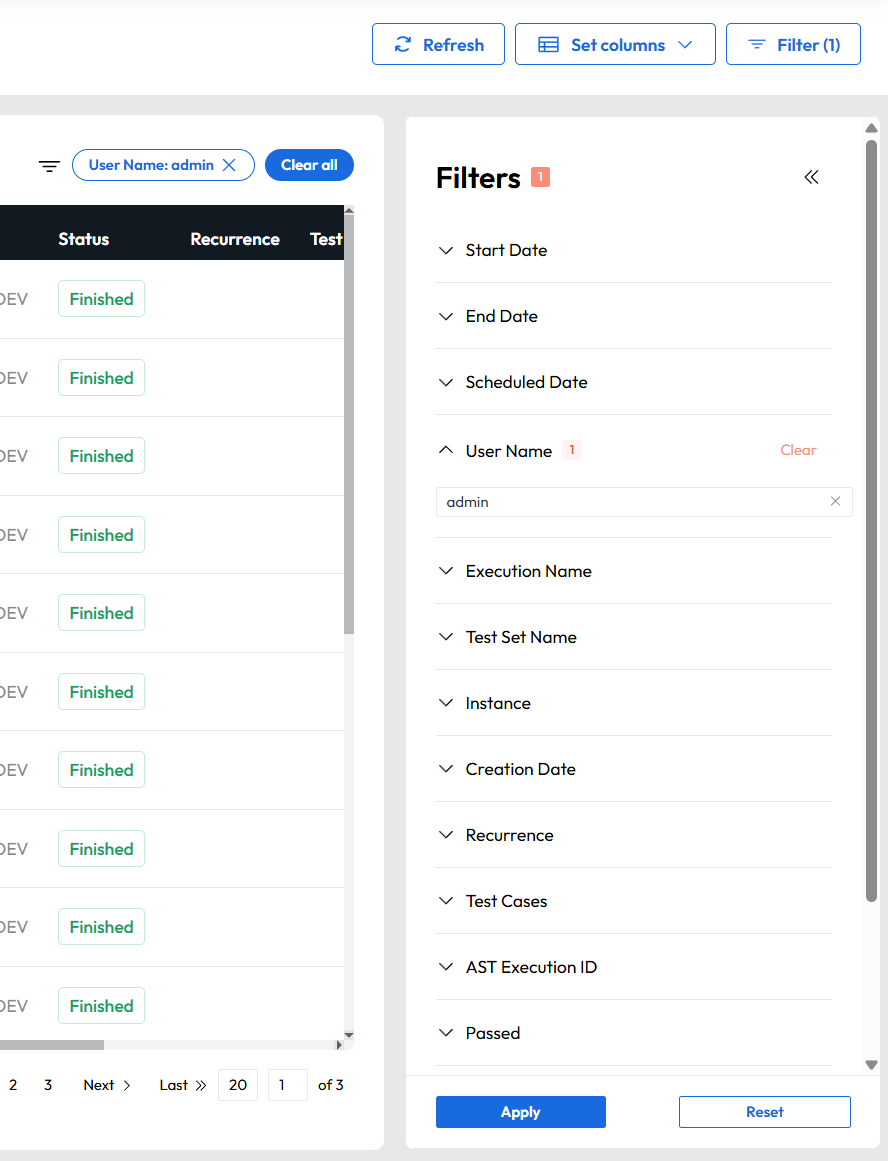
Another option is to filter by clicking the "Filter" button on the top right side of the table, which will open a collapsible panel with more filtering options. In selected filters the app offers suggestions for filters e.g. user name. If a filter is active it will be shown in the active filters tab on the top right side of the table. You can quickly clear the filters by clicking on the "x" icon next to the active filter or by clicking on the "Clear all" button which will clear all active filters at once.
In certain filters you can also select multiple values. For example, you can select multiple user names as shown in the screenshot below.
Info
The execution status filter is applied together with other filters, meaning that if you select "Scheduled" status and filter by user name "John", you will see only scheduled executions created by John. If you want to see all executions by "John", you need to set the execution status filter to "all".
Execution details
Clicking a table row of a Running or Finished execution will show the same functionality as shown in the Test set reports tab.
When clicking a table row of a Scheduled execution a dialog will be shown that gives you the option to modify or cancel the scheduled execution.
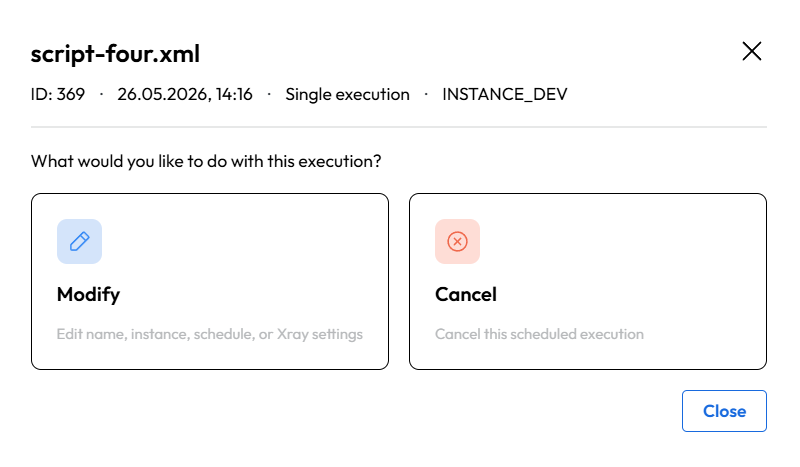
If you select the modify option, you will be navigated to another dialog where you can change the execution name, Avaloq instance, and scheduled date and time.
If you select the cancel option, a confirmation dialog will be shown to confirm the cancellation of the scheduled execution. After confirming, the execution will be cancelled and removed from the table.